
TV Viewing Statistics Ireland 2026: 84% of Television Viewing Was Live
Sources reviewed 27 October 2026 | Approximately 12-minute read | Human written and fact checked against each named source.
Television remains a major part of home life in Ireland, even as paid streaming and online video have widened the choice of what appears on the main screen. In 2025, the average adult in a television household watched 2 hours and 20 minutes of television each day, while the broader total for video watched on a television set reached 3 hours and 18 minutes, according to TAM’s annual review.
This is a 2026 statistical roundup, not a claim that every figure measures 2026. It combines TAM Ireland data for 2025 and 2026, CSO subscription data collected in the first half of 2025, Eurostat’s 2025 comparison and ComReg broadband figures for the second quarter of 2026. The periods, populations and devices are kept explicit because television viewing, TV-set video use and household subscriptions are different measures.
TV viewing statistics Ireland 2026: key figures
- The average adult in a television household watched 2 hours and 20 minutes of television per day in 2025, according to TAM Ireland’s annual review.
- 84% of that television viewing was live and 16% was catch-up viewing in 2025, in the same annual audience summary.
- Total video watched on the television set averaged 3 hours and 18 minutes per day among adults in TV households in 2025, based on TAM’s Total Video Panel.
- Broadcaster content accounted for 75% of TV-set video time, compared with 11% for subscription video-on-demand services and 6% for YouTube in 2025, according to the same TAM viewing analysis.
- The Late Late Toy Show was the most-watched programme episode of 2025, with an average audience of 1,590,200, in the TAM programme workbook.
- Adults aged 15 and over watched 121 minutes of Total TV per day in September 2026, according to the TAM monthly overview.
- Commercial television channels reached 70.9% of adults aged 15 and over in an average week in September 2026, in the same monthly audience report.
- In the CSO’s 2025 household comparison, 82% of recent internet users living in households with children paid for film, series or sports streaming, compared with 64% in households without children, according to the CSO subscription table.
- On Eurostat’s harmonised measure for recent internet users aged 16 to 74, 63.9% in Ireland paid for film, series or sports streaming in 2025, compared with 32.7% across the EU-27, according to the Eurostat streaming dataset.
TV viewing statistics Ireland 2026 Infographic
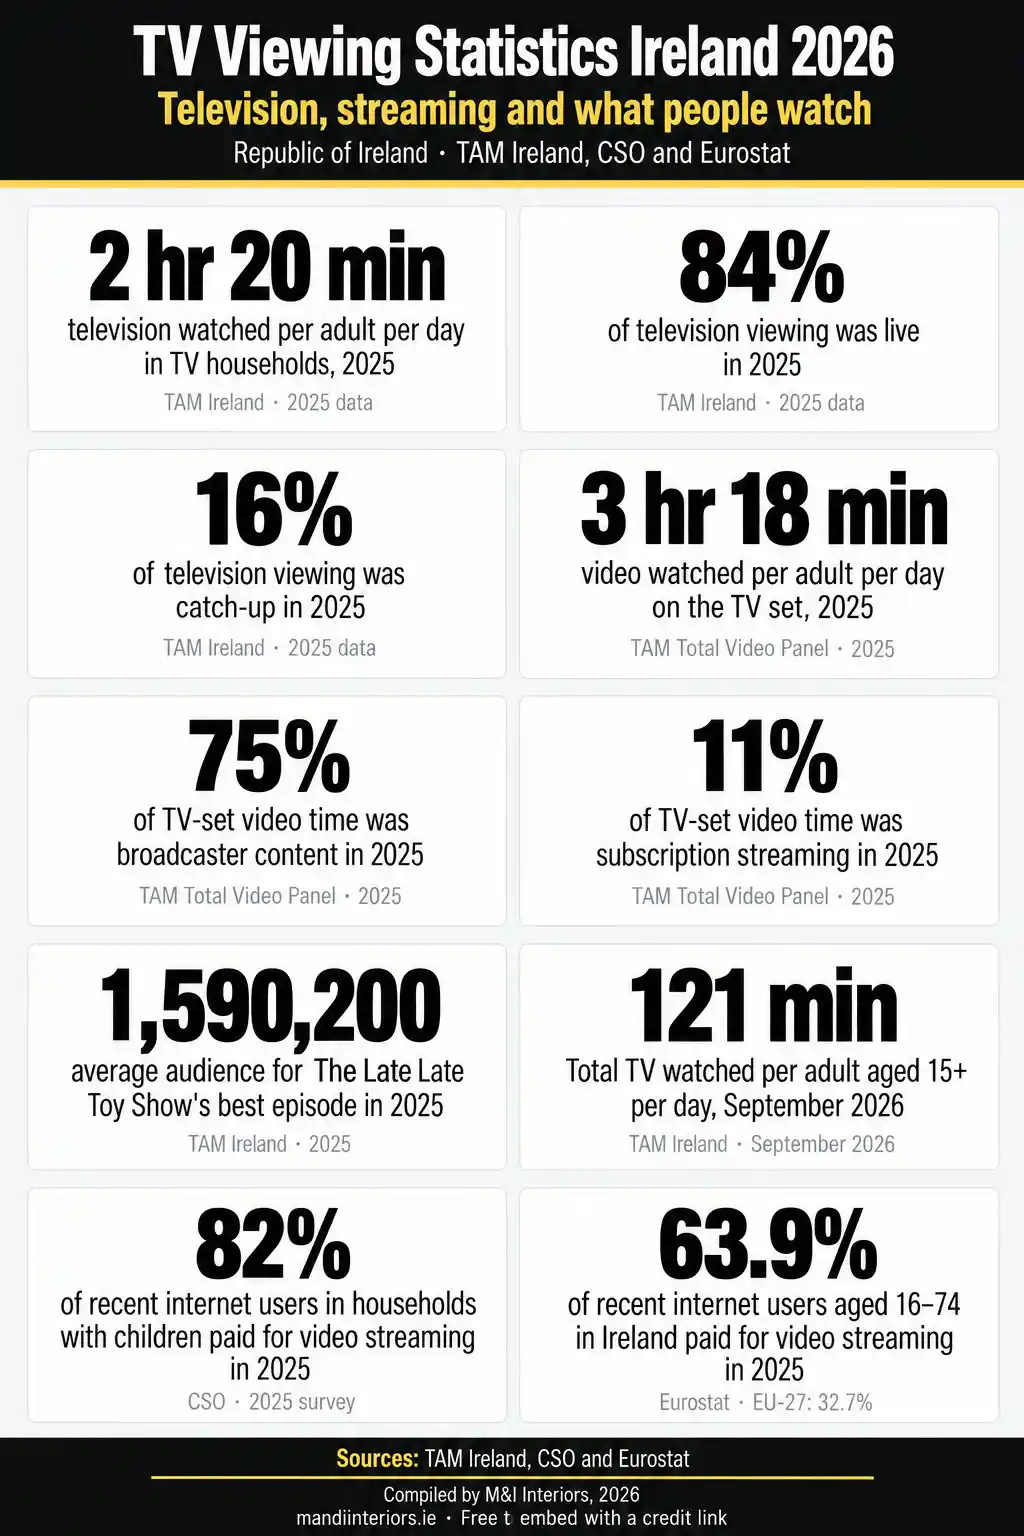
Free to embed. Please credit M&I Interiors with a link to this page: https://mandiinteriors.ie/tv-viewing-statistics-ireland/
How much television do people in Ireland watch?
The clearest annual benchmark is TAM Ireland’s 2025 total. Adults in homes with a television watched an average of 2 hours and 20 minutes of television each day, according to the annual viewing data. The measure includes live viewing and catch-up viewing within the measurement window, but it is not a total for every form of video or every device.
TAM’s broader Total Video Panel recorded 3 hours and 18 minutes of video use per adult per day on the television set, as reported in the Total Video results. That larger total includes broadcaster content, subscription streaming, YouTube and other measured TV-set use. The gap between 2 hours and 20 minutes of television and 3 hours and 18 minutes of total video is therefore a difference in scope, not a contradiction.
The latest monthly snapshot in this roundup is September 2026. Adults aged 15 and over watched 121 minutes of Total TV each day, while commercial channels reached 70.9% of that age group in an average week, according to the September audience report. Monthly data is useful for recency, but seasonal schedules mean it should not be treated as a replacement for the full-year 2025 average.
Reach and time viewed also answer different questions. Weekly reach records the percentage who watched for the qualifying minimum during the week. Average daily minutes describes time spent across the relevant population. A person can contribute to reach without watching close to the average amount.
Live television and catch-up viewing
Live viewing still made up most measured television use in 2025. TAM Ireland reported that 84% of television viewing was live and 16% was catch-up in its annual audience summary. The figures relate to viewing classified as television within TAM’s system, rather than every video played through a smart television or connected device.
The size of the live share matters when television is discussed as though scheduled viewing has disappeared. It has not. At the same time, the 16% catch-up share means a meaningful part of broadcaster viewing happened after the original transmission. The data supports a mixed picture in which scheduled programmes and time-shifted viewing coexist.
Commercial television retained broad weekly exposure in 2026. During the first quarter, commercial channels reached an average of 75% of adults aged 15 and over each week. Reach was 67% among adults aged 25 to 44 and 70.2% among TAM’s “Grocery Shoppers with Kids” group, according to the TAM first-half update. These are audience segments used in the measurement service, not percentages of all Irish households.
Broadcaster content, streaming services and YouTube on TV sets
Broadcaster content accounted for 75% of video time on the television set in 2025. Subscription video-on-demand services represented 11%, while YouTube represented 6%, according to TAM’s viewing breakdown. The remaining share covered other measured TV-set use in TAM’s published breakdown.
These percentages describe time on the main television set, not all video consumption by people in Ireland. Viewing on phones, tablets and laptops sits outside this particular device-based split. It would therefore be wrong to say that the 11% subscription share represents all video watching in Ireland.
The figures also show why “television” can mean two things in current audience discussions. It can mean broadcaster programming measured live or on catch-up, or it can mean the physical television set on which broadcaster programmes, streaming apps and online video are all watched. TAM’s separate television and Total Video measures help keep those meanings apart.
Paid streaming subscriptions in Irish households
The CSO’s Internet Coverage and Usage in Ireland 2025 survey asked recent internet users aged 16 and over whether they had purchased subscriptions to films, series or sports streaming services. Across all recent internet users in that population, 71% reported paying for this type of service, up from 69% in 2024, according to the CSO subscription release.
Household composition produced a wider difference. In 2025, 82% of recent internet users living in households with children paid for film, series or sports streaming, compared with 64% of those in households without children. In 2024, the corresponding figures were 77% and 64%, according to CSO table ICA276. The increase in the all-user figure was therefore accompanied by growth in the households-with-children group, while the published households-without-children percentage was unchanged.
This does not mean that the 82% and 64% values apply to all Irish families or every child-free household. The respondent population was people aged 16 and over who had used the internet in the previous three months, and the values were classified by their household composition. The CSO conducted the survey in the first and second quarters of 2025 and obtained detailed ICT responses from 4,034 respondents.
How paid streaming varies by age
Eurostat’s harmonised 2025 data shows that paid film, series or sports streaming was most common among recent internet users in the middle younger-adult age bands in Ireland. The proportion was 49.4% for people aged 16 to 24, 77.1% for those aged 25 to 34 and 81.5% for those aged 35 to 44 in the Eurostat streaming dataset.
The rate remained high at 74.7% among people aged 45 to 54, then fell to 50.7% for ages 55 to 64 and 31.7% for ages 65 to 74 in the same Eurostat age data. All six percentages use the same Eurostat measure and refer to people who used the internet in the previous three months, so they can be compared with one another. They are not estimates for every resident in each age group.
The age pattern is not a simple divide between the youngest and oldest adults. Ireland’s highest measured rate was among 35 to 44-year-olds rather than 16 to 24-year-olds in the Eurostat age breakdown. Household responsibilities, account sharing and purchasing arrangements may be relevant, but the dataset measures payment for the service and does not establish why the age groups differ.
What Ireland watched in 2025 and 2026
Large television audiences continued to gather around entertainment, sport and familiar Irish formats. The Late Late Toy Show recorded the largest average audience for an individual programme episode in 2025, at 1,590,200. The All-Ireland Senior Hurling Championship final between Cork and Tipperary averaged 995,300 viewers in the TAM programme workbook.
Among other leading 2025 episodes, The Traitors Ireland recorded an average audience of 818,000 for its best-ranked episode, while Room to Improve averaged 647,700 for its strongest episode in the TAM top-50 workbook. These are episode averages. They should not be described as peak audiences, unique viewers across a series or the total number who saw any part of the programme.
A more recent live event also drew a large audience. The Katie Taylor boxing broadcast on 5 September 2026 averaged 992,200 viewers, according to TAM Ireland’s September 2026 report. An individual event can exceed the daily average by a wide margin without implying that audience level is typical across the schedule.
Broadband access behind home viewing
Connected viewing depends on home internet access, although broadband statistics do not reveal what the connection was used to watch. Between July and December 2025, 93% of television homes in TAM’s establishment survey had fixed or mobile broadband, according to the TAM establishment survey. This is the broadband share within the measured universe of television households.
ComReg recorded 1.79 million fixed broadband lines in Ireland in the second quarter of 2026. Average monthly data use among residential fixed broadband subscribers was 576 GB, according to the ComReg quarterly release. Lines are subscriptions, not households or people, and the traffic total covers all activity on the connection rather than streaming alone.
Taken together, the figures provide infrastructure context for the growth of app-based viewing on television sets. They do not support a calculation of how much broadband traffic came from television or which streaming service accounted for it.
Ireland compared with the EU-27
Eurostat provides the cleanest like-for-like comparison between Ireland and the EU-27. In 2025, 63.9% of recent internet users aged 16 to 74 in Ireland paid for film, series or sports streaming services. The EU-27 average was 32.7% on the same measure, year, unit and internet-use population, according to the Eurostat comparison table.
Ireland’s rate was therefore 31.3 percentage points above the EU-27 figure, calculated from the underlying Eurostat values of 63.94% for Ireland and 32.68% for the EU-27. That is a percentage-point difference, not a claim that Irish users spent 31.3% more money or watched 31.3% more content. The measure records whether respondents paid for the service, not the number of subscriptions, expenditure or hours viewed.
The Eurostat value of 63.9% is lower than the CSO figure of 71% because the published selections are not identical. Eurostat’s comparison covers recent internet users aged 16 to 74, while the CSO’s national table includes recent internet users aged 16 and over. The two figures should be reported with their own age scope rather than blended into a single Irish rate.
Methodology and sources
M&I Interiors compiled this article from primary data published by Television Audience Measurement Ireland, the Central Statistics Office, Eurostat and the Commission for Communications Regulation. The sources were reviewed on 27 October 2026.
TAM Ireland’s audience system begins with an annual establishment survey of about 9,350 households. Its viewing panel covers 1,090 homes, approximately 2,700 individuals and about 1,500 television sets. Electronic meters and audio matching identify viewing, and the results are weighted to represent the television-household population. Further detail is available in TAM’s measurement system guide.
The annual viewing figures refer to calendar year 2025. The recent monthly figures refer to September 2026, and the commercial-channel reach figures refer to the first quarter of 2026. Programme totals are average audiences for the listed episode, not series reach or peak viewing.
The CSO survey notes state that the Household Digital Consumer Behaviour survey was conducted in the first two quarters of 2025. Its streaming percentages cover people aged 16 and over who used the internet within the previous three months. The detailed ICT module had 4,034 respondents. Eurostat’s comparison uses the harmonised 2025 measure for recent internet users aged 16 to 74. One-decimal values in this article are rounded from the displayed source values.
ComReg’s Q2 2026 data is included only as connectivity context. No fixed broadband line, household or traffic total has been treated as a streaming audience measure. Where sources measure different populations, devices or periods, the results are presented separately.
Planning a living room around the screen
Audience statistics do not prescribe how a living room should be arranged. They do show that the television set remains a shared place for broadcaster programmes, streaming services and online video, so the screen often needs to work with several kinds of viewing rather than a single fixed schedule.
Practical planning starts with a comfortable sight line, suitable screen height, controlled glare and enough ventilation around equipment. Storage can keep consoles, remotes and cables organised without crowding the room. M&I Interiors offers TV units and stands in a range of sizes and finishes for different living-room layouts.
Related Irish home statistics
Household composition helps explain why one viewing statistic cannot represent every home. Our Irish family statistics cover family structures, children and household change, while our living-alone figures examine the growing number of one-person households.
For wider context on what people buy for the home and how the market is changing, see our Irish furniture statistics roundup.