
Home Ownership Statistics Ireland 2026: Rates by Age, Tenure and Region
Sources reviewed 19 October 2026 | Approximately 11-minute read | Human written and fact checked against each named source.
Home ownership remains the most common housing tenure in Ireland, but the national rate has fallen and the age at which ownership becomes the majority position has moved later in life. Census 2022 recorded 66% of permanent private households as owner-occupied, down from 68% in 2016.
This is a 2026 statistical roundup, not a claim that every figure measures 2026. The most detailed Irish ownership, age and county figures come from Census 2022. The Ireland and Northern Ireland comparison combines their 2022 and 2021 censuses, while the latest European comparison in this article uses Eurostat data for 2025.
The measures are kept separate throughout. Census figures describe households and dwellings, while Eurostat describes people living in households. Age statistics refer to the household reference person, not every individual of that age.
Home ownership statistics Ireland 2026: key figures
- 66% of permanent private households were owner-occupied in Census 2022, down from 68% in 2016, according to the CSO housing profile.
- Ireland had 1,210,925 owner-occupied permanent private households in 2022, calculated from the mortgage and outright categories in CSO table F2010.
- 531,207 households owned with a mortgage or loan, equal to 28.9% of permanent private households in 2022, based on the CSO tenure table.
- 679,718 households owned without a mortgage or loan, equal to 37.0% of the 2022 total, in the same Census dataset.
- 513,704 households rented their accommodation in 2022, including private, local-authority and voluntary or co-operative renting, according to the CSO tenure findings.
- Age 36 marked the point by which more than half of household reference persons owned their home in 2022, up from age 26 in 1991, in the Census age analysis.
- 374,417 households headed by someone aged 65 or over owned outright in 2022, 17.1% more than in 2016, calculated from CSO age data.
- Dublin City had 106,623 owner-occupied households, equivalent to 47.3% of its permanent private household total in 2022, calculated from CSO county data.
- Meath had 54,522 owner-occupied households, equivalent to 75.2% of its permanent private household total, in the same county dataset.
- In the person-based European measure for 2025, 70.9% of Ireland’s population lived in an owner-occupied household, compared with 68.5% across the EU-27, according to the Eurostat tenure dataset.
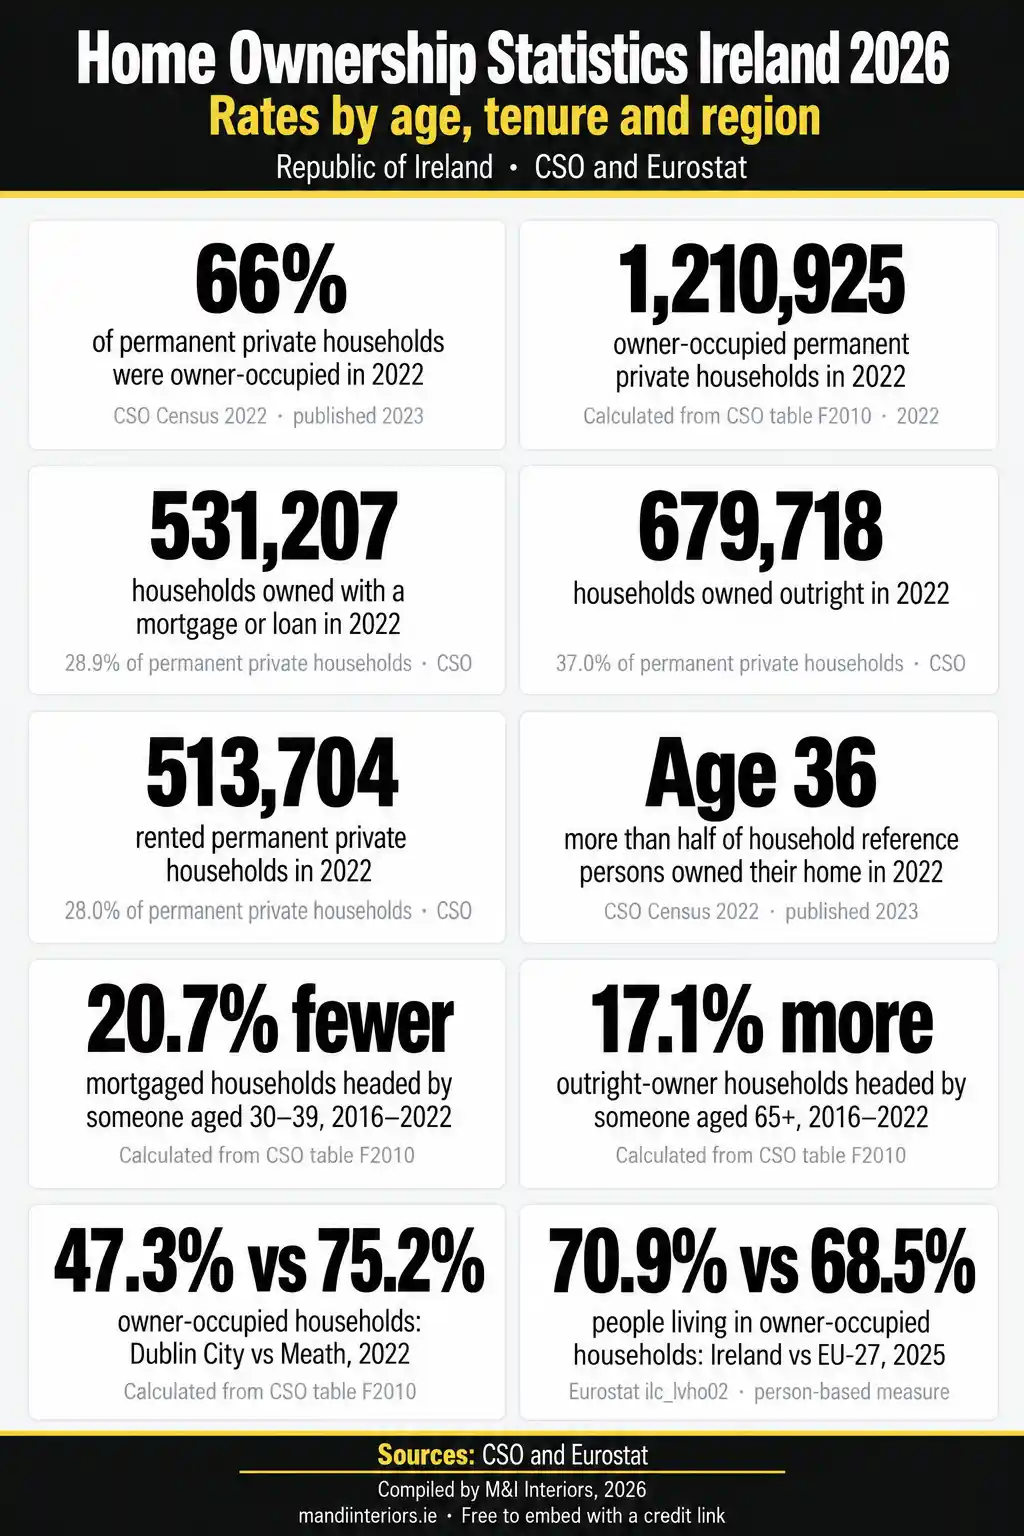
Free to embed. Please credit M&I Interiors with a link to this page: https://mandiinteriors.ie/home-ownership-statistics-ireland/
What is Ireland’s home ownership rate?
The headline Census home ownership rate was 66% in 2022. This combines two categories: homes owned with a mortgage or loan and homes owned without one. The rate applies to occupied permanent private dwellings and the households living in them. It should not be described as the percentage of individual Irish adults who own property.
The direction of travel has been downward. The CSO ownership release reports a fall from 68% in 2016 to 66% in 2022. The underlying table records 583,148 mortgaged households and 566,776 outright-owner households in 2011. Together, those 1,149,924 owner-occupied households represented 69.7% of the 1,649,408 permanent private households counted that year.
Household numbers and rates can move differently. Ireland had more owner-occupied households in 2022 than in 2011, but owner occupation represented a smaller share of a larger household total. That is why an ownership count should not be substituted for the ownership rate.
Ownership with a mortgage versus owning outright
Ireland’s 1,210,925 owner-occupied permanent private households in 2022 were split between 531,207 households with a mortgage or loan and 679,718 that owned without one. Those categories represented 28.9% and 37.0% respectively of all permanent private households, calculated from the exact cells in CSO table F2010.
The two categories followed different trends between 2016 and 2022. Mortgaged owner-occupied households fell from 535,675 to 531,207. That was a decline of 4,468 households, or 0.8%, which the published CSO summary rounds to 1%.
Outright ownership rose from 611,877 to 679,718 over the same period. The increase of 67,841 households was equal to 11.1%. The figures describe the changing stock of households in each tenure category. They do not identify how many properties were bought during the period or explain why the mix changed.
Renting formed the largest tenure group outside ownership. Census 2022 counted 513,704 rented permanent private households, equal to 28.0% of the total. The detailed CSO occupancy table divides these into 330,632 households renting from a private landlord, 153,192 renting from a local authority and 29,880 renting from a voluntary or co-operative housing body.
Private-landlord renting therefore represented 18.0% of permanent private households, while local-authority renting represented 8.3% and voluntary or co-operative renting represented 1.6%. These Census categories should not be treated as a count of active Residential Tenancies Board registrations because their definitions and collection methods differ.
How home ownership changes with age
Age is one of the clearest dividing lines in the Census tenure data, but the definition needs care. The Census background notes define a reference person for each private household. The age results describe households grouped by that person’s age. They are not individual ownership rates for every person in an age band.
In 2022, age 36 marked the changeover at which more than half of household reference persons owned their home. The equivalent age was 35 in 2016 and 26 in 1991, according to the CSO age profile.
A second milestone also moved later. Two-thirds of household reference persons owned their home by age 44 in 2022, compared with age 41 in 2016. In 1991, the two-thirds threshold had been reached by age 28. The point at which a majority owned without a mortgage or loan was age 59 in 2022, compared with age 56 in 1991.
The household counts underline how tenure changed within age groups. Among households headed by someone aged 30 to 39, the number owning with a mortgage or loan fell from 146,083 in 2016 to 115,859 in 2022. That was a reduction of 30,224 households, or 20.7%, calculated by summing the single-year ages in the CSO age table.
At older ages, outright ownership increased. Households headed by someone aged 65 or over and owning without a mortgage rose from 319,651 in 2016 to 374,417 in 2022. The increase was 54,766 households, or 17.1%.
Older private renting also grew. Census 2022 counted 16,986 private-landlord households headed by someone aged 65 or over, calculated from the grouped ages in CSO table F2004. The CSO findings describe this as an 83% increase since 2016. Among households headed by someone aged 60 to 64, the 2022 count was 11,123 and the published increase was 69%.
Home ownership by county and city
Local tenure patterns differed considerably in Census 2022. The figures here use administrative counties and cities rather than broader planning regions. Each ownership rate is calculated by adding mortgaged and outright-owner households, then dividing by all permanent private households in the same area in CSO table F2010.
Galway City had 14,219 owner-occupied households out of 30,872 permanent private households, producing a rate of 46.1%. Dublin City recorded 106,623 out of 225,519, or 47.3%. These figures apply to the administrative cities. Galway City should not be combined with Galway County, and Dublin City does not represent the full Dublin region.
At the other end of the selected comparisons, Meath recorded 54,522 owner-occupied households out of 72,549, equal to 75.2%. Galway County also recorded 75.2%, based on 50,978 owner-occupied households out of 67,782.
The number of homes owned with a mortgage also moved differently across the country. Donegal’s count fell from 16,335 in 2016 to 14,712 in 2022, a 9.9% reduction. Tipperary fell from 17,616 to 16,256, a decrease of 7.7%. The CSO county summary rounds these changes to 10% and 8%.
Meath moved in the opposite direction, with mortgaged households increasing from 27,678 to 30,191. That was a rise of 9.1%. Kildare increased from 30,295 to 32,264, equal to 6.5%. These are changes in the number of households occupying homes with a mortgage, not measures of first-time-buyer activity or property transactions.
Ireland and Northern Ireland compared
The most defensible cross-border comparison comes from the joint CSO and NISRA census publication. It harmonises tenure categories from the Northern Ireland Census 2021 and Ireland Census 2022 while preserving the separate jurisdictions and reference years.
Home ownership accounted for 66% of private households in Ireland and 65% in Northern Ireland, according to the joint housing release. Ownership with a mortgage or loan represented 29% in Ireland and 30% in Northern Ireland. Outright ownership accounted for 37% and 35% respectively.
Private-landlord renting was also close, at 18% of households in Ireland and 17% in Northern Ireland.
The comparison should not be described as a single all-island rate. It combines two censuses conducted in different years, and the published percentages are rounded.
Ireland in EU home ownership statistics
Eurostat provides a more recent international comparison, but it uses a different denominator from the Irish Census. Its EU-SILC table measures the percentage of people living in households with each tenure status. It does not measure the percentage of dwellings or households.
In 2025, 70.9% of Ireland’s population lived in an owner-occupied household, compared with 68.5% across the EU-27, according to the Eurostat housing table. Ireland’s total was made up of 36.2% living in owner-occupied households with a mortgage or housing loan and 34.7% living in owner-occupied households without one.
Across the EU-27, 24.8% lived in an owner-occupied household with a mortgage or loan, while 43.7% lived in one without an outstanding mortgage or housing loan. Tenants represented 29.1% of Ireland’s population and 31.5% of the EU-27 population in the same 2025 table.
These person-based figures are suitable for comparing Ireland with the EU-27 because they use the same Eurostat dataset, unit, year and household-population coverage. They should not be used to update the Census statement that 66% of Irish permanent private households were owner-occupied in 2022. Both figures are valid, but they answer different questions.
Methodology and sources
M&I Interiors compiled this roundup from primary data published by the Central Statistics Office, the joint CSO and Northern Ireland Statistics and Research Agency census publication, and Eurostat. The sources were reviewed on 19 October 2026.
The central Irish source is Census of Population 2022 Profile 2, published by the CSO on 27 July 2023. Census night was 3 April 2022. The detailed calculations use PxStat table F2010 for tenure by single year of age and administrative county or city, and PxStat table F2004 for the detailed rental categories and grouped ages.
A permanent private household is a person living alone or a group with common housekeeping arrangements in a permanent dwelling. The reference person is selected using the rules set out in the CSO methodology notes. Census results are a complete-enumeration source, so the confidence-interval conventions used for sample surveys do not apply.
The cross-border section uses the joint CSO and NISRA publication released on 2 July 2025. Ireland’s data refers to 2022 and Northern Ireland’s to 2021. The EU section uses Eurostat dataset for 2025, with annual frequency, percentage units, all household compositions and the EU-27 aggregate from 2020. Eurostat’s values are EU-SILC survey estimates and the cited dissemination table does not provide confidence intervals for the selected cells.
Calculated rates use exact, unrounded source cells and are rounded to one decimal place in this article. No county ranking is claimed from the selected examples, and no change in tenure is presented as proof of a cause.
Designing homes for different stages of ownership
Tenure statistics describe how people occupy their homes, not what design choices they intend to make. They still provide useful context for the different stages at which households may be furnishing, reorganising or adapting a property.
A newly mortgaged home may need a phased room plan and carefully prioritised purchases. A long-owned home may need layouts, storage or furniture reconsidered as household needs change. Renters may favour flexible pieces that can move between properties. These are practical design considerations, not conclusions measured by the Census.
M&I Interiors provides interior design services for individual rooms, new homes and wider renovation projects. The process can include space planning, furniture and finish selection, 3D visualisation and implementation support, shaped around the household, property and available budget.
Related Irish housing statistics
For current context on completions, buyer types, prices and mortgage drawdowns, see our new homes statistics roundup.
For floor area, bedroom counts, rooms per person and overcrowding, explore our home size statistics. Readers interested in tenure and space within flats can also use our apartment living statistics.