
Living Alone Statistics Ireland 2026: 425,974 People in Census 2022
Sources reviewed 22 September 2026 | Approximately 11-minute read. | Human written and fact checked against each named source.
Living alone is not one kind of housing experience. It includes younger renters, people paying a mortgage and older outright owners, in cities, towns and rural areas. Those differences matter when describing Irish homes and the people who use them.
This roundup brings together the most useful primary figures on one-person households in the Republic of Ireland. It was prepared in 2026, but the latest complete Census count describes 2022, income estimates in the 2025 Survey on Income and Living Conditions refer to 2024 income, and the harmonised European household comparison measures 2025. Each figure below keeps its own period and denominator visible. CSO Census profile, CSO income tables, Eurostat household dataset.
Living-alone statistics in Ireland at a glance
- 425,974 people lived alone in private households in the State in Census 2022. The count was 26,159, or a rounded 7%, higher than in 2016. CSO Census profile
- One-person households made up 23.1% of private households in 2022, compared with 23.5% in 2016. These are household shares, not population shares. CSO urban-rural release
- People living alone accounted for 8% of people in private households in Census 2022. This answers a different question from the 23.1% household share. CSO Census profile, CSO urban-rural release
- Among people aged 65 or over in the relevant Census 2022 household population, 25.9% lived alone. For those aged 85 or over, the rate was 44.1%. CSO urban-rural release
- 204,515 people living alone, or a rounded 48%, owned their home outright in Census 2022. CSO Census profile
- In 2022, one-person households represented 28.7% of households in highly rural or remote areas, compared with 18.2% in rural areas with high urban influence. CSO urban-rural release
- In SILC 2025, the median nominal disposable income of a one-person household was €26,854. That survey’s income reference year was 2024. CSO income tables
- The SILC 2025 at-risk-of-poverty estimate was 30.3% for people in one-adult households aged 65 or over, using 2024 income. This is a weighted survey estimate, not a Census count. CSO poverty tables
- In Eurostat’s comparable 2025 household-type series, one-adult households accounted for 21.9% of Irish households and 35.7% of households across the EU-27. Eurostat household dataset
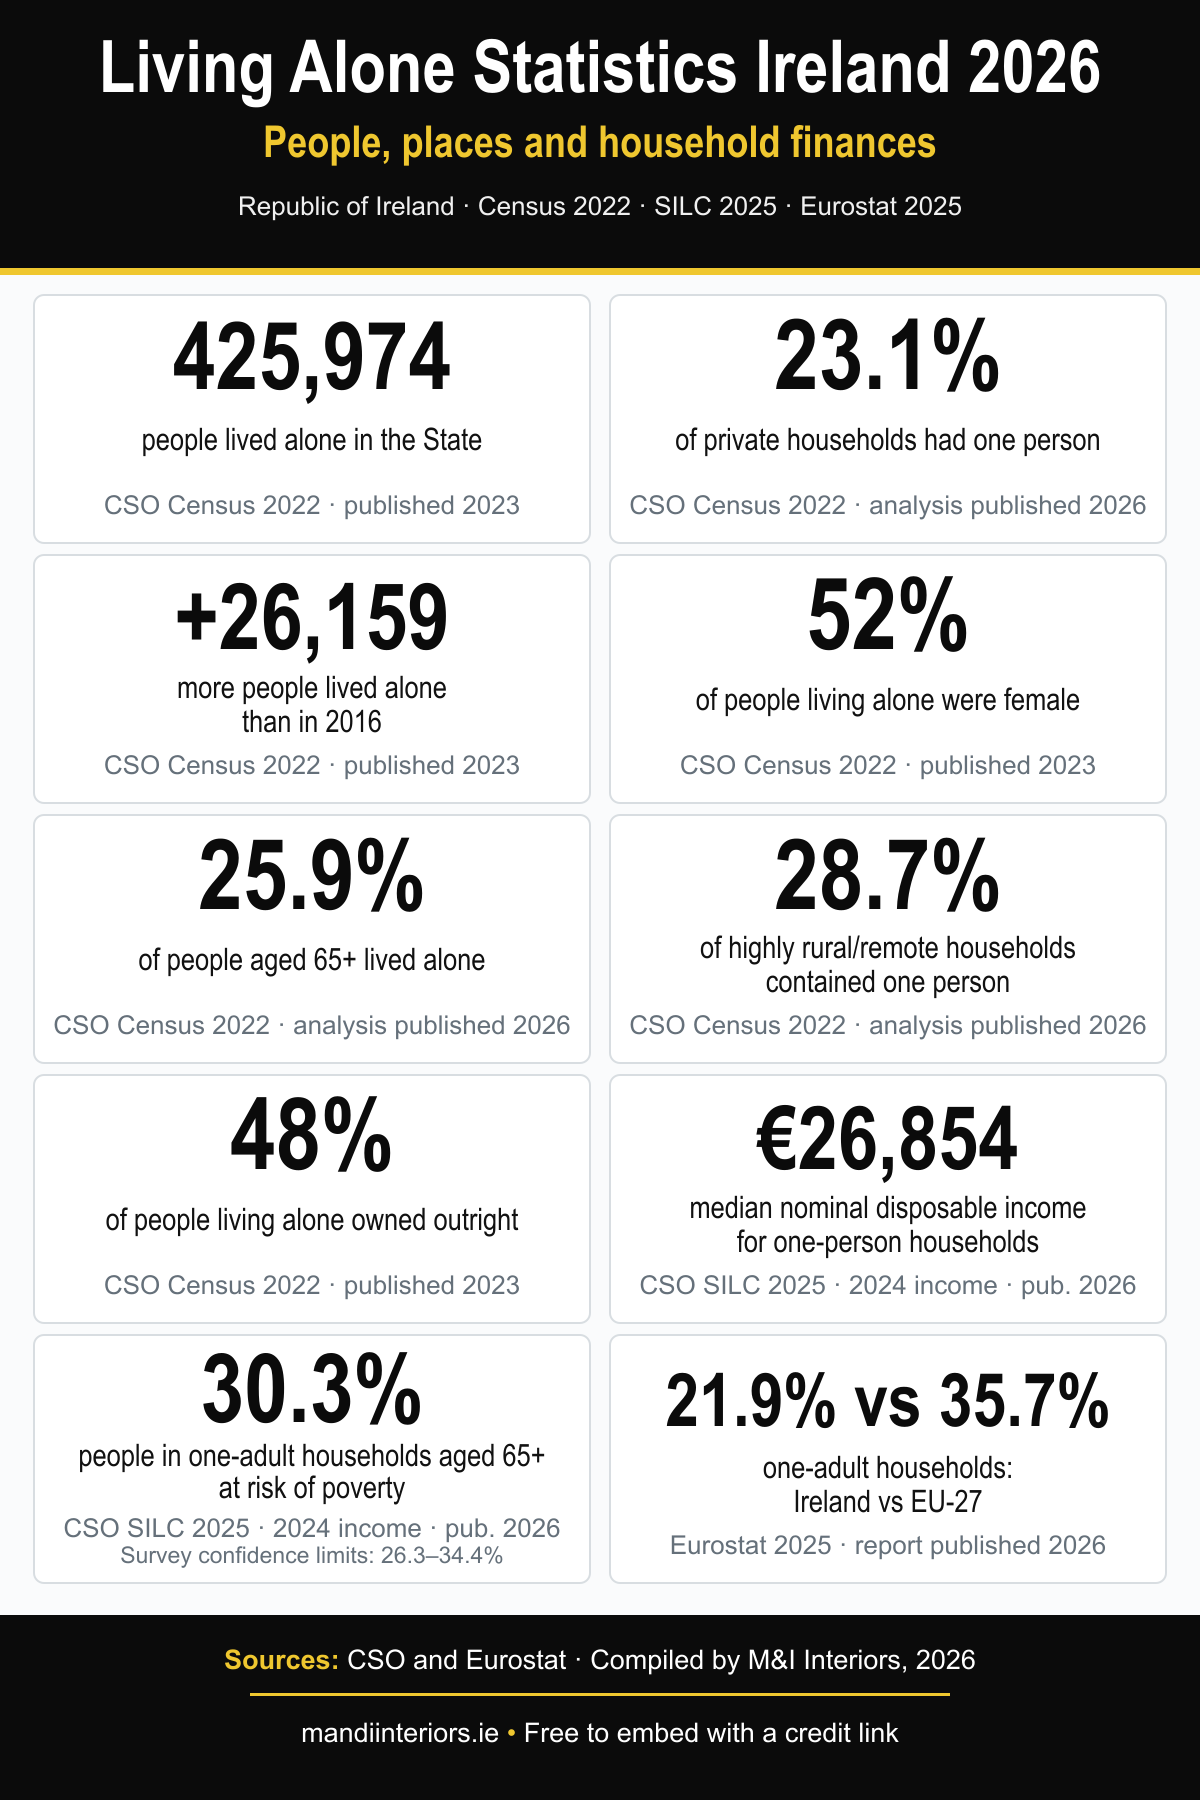
Free to embed. Please credit M&I Interiors with a link to this page: https://mandiinteriors.ie/living-alone-statistics-ireland/
How many people live alone in Ireland?
The CSO Census profile counted 425,974 people living alone in private households in 2022. That is the clearest full-enumeration answer to the question. It is an observed Census figure, not a forecast or an estimate of how many people live alone in 2026.
The same CSO Census profile says these residents represented 8% of all people living in private households. By contrast, the CSO’s later urban-rural analysis reports that 23.1% of private households contained one person in 2022. Both percentages are correct because one divides by people and the other by households. A one-person household contributes one person to the population denominator, while a larger household contributes several.
In the Census definition, a private household can be one person alone or a group, related or not, sharing a dwelling and common housekeeping arrangements. Household members are usual residents, rather than every visitor present on Census Night. The CSO background notes explain why this definition is more precise than treating everyone at one postal address as a single household.
“Living alone” is also different from marital status. A person may live alone while married, separated, widowed or never married. Equally, a single person may live with parents, children or housemates. The statistic describes a household arrangement, not a person’s relationship status, satisfaction with that arrangement or type of dwelling.
Has living alone become more common?
The number of people living alone was 26,159 higher in Census 2022 than in 2016, a rounded 7% increase, according to the CSO Census profile. In absolute terms, more people had a home to themselves at the later Census. That finding does not establish what happened in each intervening year, or what has happened since 2022.
The share of households tells a different story. The CSO urban-rural release reports that one-person households made up 23.5% of all private households in 2016 and 23.1% in 2022. The count rose, but the proportion of all households slipped slightly because the overall household population changed too. Calling this either an unqualified “rise in living alone” or an unqualified “decline in living alone” would conceal which measure is being discussed.
The Census remains the latest completed full count for this question. Ireland’s next Census is scheduled for 2027, as the CSO Census timetable confirms. A report issued in 2026 may contain fresh analysis of Census 2022, but its publication date cannot turn those household observations into 2026 data.
Later surveys can illuminate particular dimensions without replacing that count. The CSO’s annual income and living-conditions survey samples households and weights the responses to represent the population. It is useful for income and deprivation, but its subgroup rates should not be multiplied casually by the older Census count to claim an exact new number of people living alone.
Who lives alone? Age and sex in the Census
In Census 2022, 52% of people living alone were female, the CSO Census profile reports. That is a share among people who lived alone. It is not a statement that most women lived alone, and it does not mean that the experience of a younger woman and an older woman was alike.
The likelihood of living alone rose with age. In the CSO’s age and area breakdown, 25.9% of people aged 65 or over lived alone in Census 2022, rising to 44.1% of those aged 85 or over. Here the denominator is everyone in the respective age group covered by the measure, not everyone living alone. The Census profile expresses the older age-group rate as a rounded 44%; the later release provides the one-decimal figure.
Age should not be treated as a simple explanation for a person’s household circumstances. The Census shows how the proportion varies, but it does not establish why any individual lives alone or whether they would prefer another arrangement. It also cannot support a claim that living alone itself creates a particular health or wellbeing outcome.
For home planning, the age split is a reminder that a one-person household is not a single design brief. A working-age renter furnishing a temporary home and an older outright owner adapting a long-held family house may have very different rooms, budgets and preferences. Those practical differences should be discovered from the person and the property, not guessed from the national average.
Where are one-person households found?
Dublin City had the largest local-authority count in the CSO Census profile: 61,525 people living alone in 2022. County Cork followed with 49,705. Larger places can have larger counts simply because they contain more residents, so these figures should not be mistaken for the highest local rates.
The CSO’s six-way urban-rural classification gives a different view of the same Census period. 28.7% of private households in highly rural or remote areas contained one person in 2022, the highest share among the six area types. In rural areas with high urban influence, the corresponding share was 18.2%, the lowest. “Rural” is therefore not one uniform category in this analysis.
Those rates sit alongside quite different raw counts. The CSO urban-rural table records 147,643 one-person households in its “Cities” area type and 89,533 in independent urban towns in 2022. The “Cities” category is a statistical area type covering more than Dublin City, so its total must not be presented as a Dublin figure.
Among people aged 65 or over, the CSO area breakdown records a 31.3% living-alone rate in independent urban towns, compared with 20.4% in rural areas with high urban influence. For those aged 85 or over, the rates in those same area types were 49.3% and 38.1%. These are age-specific rates within area types, not the percentages of all households that contain one person.
The geography matters for interpretation. Someone reading the figures for local housing, community services or home design should choose the unit that answers the question: an area count for the scale of need, or an age-specific rate for how common living alone is within a group. Neither number alone describes the size, condition or layout of the homes involved.
Do people living alone own or rent their homes?
Ownership outright was the largest tenure category among people living alone in Census 2022. The CSO tenure breakdown records 204,515 outright owners, a rounded 48% of all people living alone. This is a useful corrective to the idea that every one-person household is a young renter in a compact flat. The figure says nothing by itself about the number of bedrooms or how much usable floor area each owner had.
A further 62,529 people living alone owned with a mortgage or loan in 2022, around 15% of the group in the CSO tenure breakdown. Ownership with a loan is not the same as outright ownership, so those categories should remain separate when quoting the source.
Renting was varied too. The CSO tenure breakdown counted 68,910 people living alone who rented from a private landlord, described as over 16% of all people living alone. Another 54,844, or 13%, rented from a local authority or voluntary body. Those categories have different housing conditions and should not be reduced to an undifferentiated “renter” stereotype.
The age profile within rented accommodation is also worth noting. Of people living alone in all rental accommodation in 2022, 66,959 were aged 50 or over, which was 54% of that rental group, while 12,565 were under 30, or 10%, in the CSO Census profile. Those percentages are not shares of all one-person households; their denominator is people living alone who rent.
Tenure does not establish the home’s size, either. Some outright owners may occupy smaller homes, while some renters may have more generous space. The sensible furnishing questions are still about the room’s dimensions, circulation, storage and how the resident wants to live in it. For separate evidence on dwelling area and room counts, M&I Interiors’ Irish home size statistics covers those measures directly.
What do the income and hardship figures show?
The CSO household income tables give a €26,854 median nominal disposable income for one-person households in SILC 2025. The survey was published in 2026, but the income recorded for this measure relates to calendar year 2024. “Median” means the middle of the estimated household-income distribution, not the average income of every person living alone, and “nominal” means the figure has not been adjusted for inflation.
Age-specific one-adult households differed in that survey. In the CSO income table, the median nominal disposable income was €22,237 for households composed of one adult aged 65 or over and €32,199 for those composed of one adult under 65, again referring to 2024 income. These are cross-sectional subgroup estimates, not evidence that an individual’s income changes by that amount on reaching a birthday.
Income is only one dimension of hardship. The CSO poverty analysis estimated that 30.3% of people in one-adult households aged 65 or over were at risk of poverty in SILC 2025, compared with 20.0% in one-adult households under 65. The measure uses equivalised household income below a relative threshold, based on 2024 income. It does not say that every person below that threshold experienced the same material conditions.
These are sample estimates, so their uncertainty belongs near the claim. The CSO precision table gives confidence limits of 26.3% to 34.4% around the older one-adult household estimate and 15.7% to 24.4% around the younger estimate. Quoting the point estimates is useful, but small apparent year-to-year movements should not be overinterpreted without examining the survey precision and methods.
For enforced deprivation, the CSO poverty analysis estimated 18.3% among people in one-adult households aged 65 or over and 21.7% among those under 65 in the 2025 survey. The CSO background notes give confidence limits of 14.0% to 22.6% and 16.5% to 26.8%, respectively. Enforced deprivation reflects being unable to afford at least two specified items or activities. It is not a count of people unable to buy furniture, and it should not be used as a retail sales argument.
Ireland compared with the EU
Eurostat’s household-type dataset offers a comparison that holds the year, unit and classification consistent. In 2025, households with one adult represented 21.9% of all private households in Ireland, against 35.7% across the EU-27. Both are percentages of households from the same harmonised Eurostat series, so this is more defensible than placing the Irish Census 2022 share beside an EU figure from another survey.
The Eurostat dataset also divides one-adult households by sex. One-single-male households accounted for 11.1% of all Irish households and 16.1% of EU-27 households in 2025. The corresponding one-single-female shares were 10.8% and 19.6%. These are shares of all households, not shares among people living alone. Eurostat’s living-conditions report rounds the overall Irish share to 22%, while the underlying dataset gives 21.9%.
This comparison describes household composition, not quality of life or available space. A lower Irish one-adult household share cannot, on its own, tell us whether people prefer to share homes, find living alone affordable or can find suitable properties. It should not be turned into an EU ranking or a causal claim. The Eurostat estimate and Census share may differ because they use different sources, definitions and periods; they are not two points in a single Irish time series.
Methodology and sources
This article was prepared from the CSO Census profile, the CSO’s urban-rural release, the CSO income tables, the CSO poverty tables and Eurostat’s household-type dataset. Their primary pages and underlying definitions were reviewed on 22 September 2026. M&I Interiors would be compiling and explaining these statistics, not claiming to have collected the original data.
The Census counted usual residents in private households in the State on 3 April 2022. Its relevant household-profile chapter was published on 31 August 2023. The CSO’s Urban and Rural Life in Ireland, 2025 was published on 21 April 2026, but the living-alone statistics used here still come from Census 2022. The Census methodology explains the household definition and enumeration basis; the urban-rural release identifies the area types.
SILC 2025 is a weighted household survey rather than a full count. Its background notes report that the achieved sample comprised 4,705 households and 11,617 individuals in 2025. Income estimates refer to January to December 2024; poverty rates use those incomes, while the deprivation questions describe circumstances reported in the 2025 survey. The article quotes no exact national count derived from a SILC subgroup rate. Published confidence limits are included for the poverty and deprivation estimates discussed above.
The EU section uses Eurostat’s 2025 household-type series for both Ireland and the EU-27. It does not mix in the separate Eurostat EU labour-force household-composition series, and it does not treat Census 2022 versus Eurostat 2025 as an Irish trend. No future projection appears in this article. Census 2022 is the latest completed census for this subject; the next is scheduled for 2027, per the CSO Census timetable.
How M&I Interiors can help
These statistics describe a varied set of households, not a template for how a solo resident should furnish a home. The resident’s routines, ownership or rental conditions, room measurements and preferred style matter more to an individual design decision than a national average. Living alone does not, by itself, imply a compact apartment, a need for more storage or a particular budget.
M&I Interiors’ interior design services include room planning and furniture selection around a property’s actual layout. A conversation about how the room is used can guide the proportion of seating, dining furniture and storage without assuming every one-person household has the same priorities. The Census and survey figures offer context; they are not evidence that a product changes someone’s income, wellbeing or social circumstances.
Related Irish home statistics
Household composition is only one part of how a home functions. The Irish apartment living statistics look specifically at apartment residents, location, tenure and space, while the Irish home size statistics cover bedrooms, floor area and room availability. For the market and purchasing context behind the pieces used to furnish those homes, see the Irish furniture market statistics.